Girls Weight chart in lbs for Children 11 years & 4 months old
General Summary: 11 year & 4 month old girls weight
In most cases, weight measurements for 11 year & 4 month old girls will be in the range between 61 and 134 lbs. The average weight for 11 year & 4 month old girls is 85 lbs, according to the CDC and anonymized data from users.All Results
Enter your weight measurements above to see how they compare
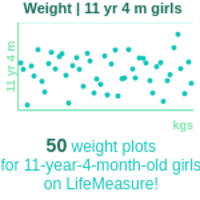
So far, we have recorded 0 weight measurements for 11-year-4-month girls on LifeMeasure!
(chart updates daily)
Weight chart for 11 Years 4 Months girls
What the weight percentiles tell us about girls at 11 Years 4 Months.
Weight percentiles for 11 Years 4 Months girls
Using CDC reference standards, the weight percentiles for girls at 11 Years 4 Months are:
5th percentile: 63.1 lbs
25th percentile: 74.6 lbs
50th percentile (median): 84.9 lbs
75th percentile: 98.1 lbs
95th percentile: 124.9 lbs
The percentile values on this page are displayed in lbs.
A percentile shows how your child's measurement compares with girls of the same age and sex. Being at the 50th percentile means exactly half of girls measure more and half measure less.
What to expect at 11 Years 4 Months
Weight at 11 years is heavily influenced by pubertal stage, which varies considerably between individuals. Girls at this age are often mid-pubertal growth spurt, with weight gains of 4-8 kg per year possible during this phase. Healthy eating patterns that support both bone density (calcium-rich foods) and muscle development (adequate protein) are particularly important during the pubertal years.
Family habits that support healthy weight
For primary school-age children, the most evidence-based supports for healthy weight are regular family meals, adequate sleep (9-11 hours for ages 6-12), at least 60 minutes of moderate to vigorous physical activity daily, and limited ultra-processed food and sugary drinks.
Talking about weight with children
Avoid discussing weight, body size, or dieting in front of children - research links this to higher rates of disordered eating in adolescence. If a GP or school nurse identifies a weight concern, framing any lifestyle changes in terms of energy, strength, and wellbeing is more effective and less harmful than weight-focused messaging.
When to involve a health professional
If you have concerns about a child's weight, the school nurse or GP is the appropriate first point of contact. They can assess whether the pattern is concerning in context of the full growth history and refer to a paediatric dietitian or specialist if needed.
Frequently asked questions
How much weight does a child gain per year?
After infancy, the rate of weight gain slows considerably. Toddlers typically gain 1.5-2 kg per year, preschoolers around 2 kg per year, and school-age children 3-5 kg per year. During puberty, the rate accelerates significantly - 4-8 kg per year is common during the peak growth phase.
Should I be concerned if my child's weight has stayed the same for a few months?
Brief weight plateaus are common in growing children and are usually not a cause for concern if the child appears healthy, has a good energy level, and is growing in height. A plateau of 3 months or more, particularly if accompanied by any health concerns or a fall across percentile lines, is worth discussing at the next GP or child health check.
What is a healthy weight for this age?
The percentile table on this page shows the full range of typical weights. All values from the 5th to the 95th percentile are within normal limits. Weight at a single point in time is less informative than a consistent growth pattern - a child who has always been at the 25th percentile and remains there is growing normally.
Data sources and methodology
The percentile ranges on this page are drawn from CDC growth chart data from the National Center for Health Statistics and WHO Child Growth Standards (for children under 5). CDC data published May 30, 2000, with 2022 extended BMI tables. Percentiles are modelled using the LMS method (Box-Cox transformation), which accounts for the skewed distribution of measurements at each age. All measurements are given in metric units with imperial equivalents.
Individual variation is normal and expected. A healthcare provider can help interpret these measurements in context with overall health and development.
See more ages